

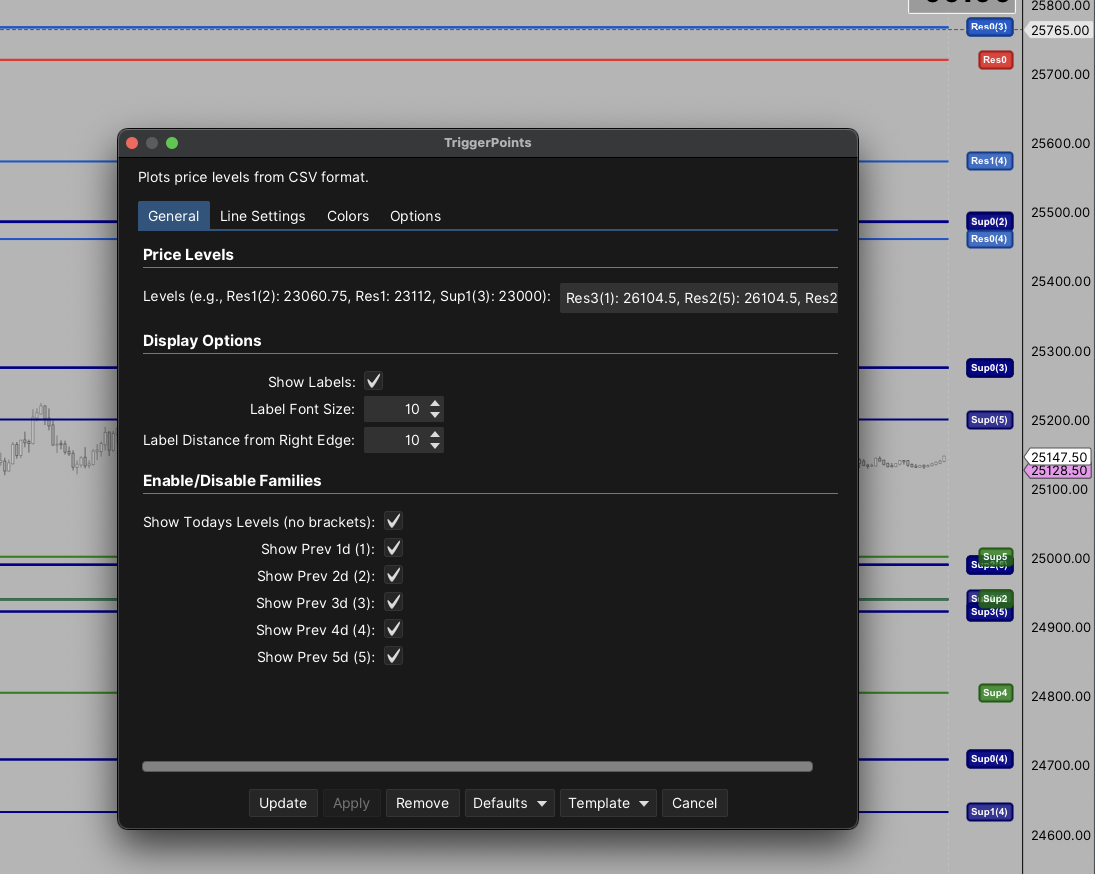
Core Functionality:
- Plots customizable horizontal resistance and support levels from simple CSV input format
- Displays price levels across multiple timeframes
- Professional-looking anchored labels with rounded backgrounds positioned at chart’s right edge
Customization Options:
- Individual On/Off Toggles: Enable/disable each S/R line
- Full Color Control: Separate color settings for resistance and support for each line (12 total color options)
- Line Styling: Adjustable thickness (1-5) and 5 different line styles (solid, dash, dot, dash-dot, etc.)
- Label Control: Show/hide labels, adjust font size (8-16), and distance from right edge
Smart Design:
- Automatic text color: Labels use black or white text based on background brightness for optimal readability
- Layered rendering: Today’s levels always display on top of historical levels for clarity
- Flexible input: Simple CSV format like
Res1: 23060.75, Sup1: 23000 - Clean interface: Organized settings across 3 tabs (General, Line Settings, Colors)
Use Cases:
- Mark key support/resistance levels from previous trading days
- Track multi-day price action zones
- Visually distinguish between current and historical price levels
- Quick reference for SR lines across different timeframes
Reviews
There are no reviews yet.